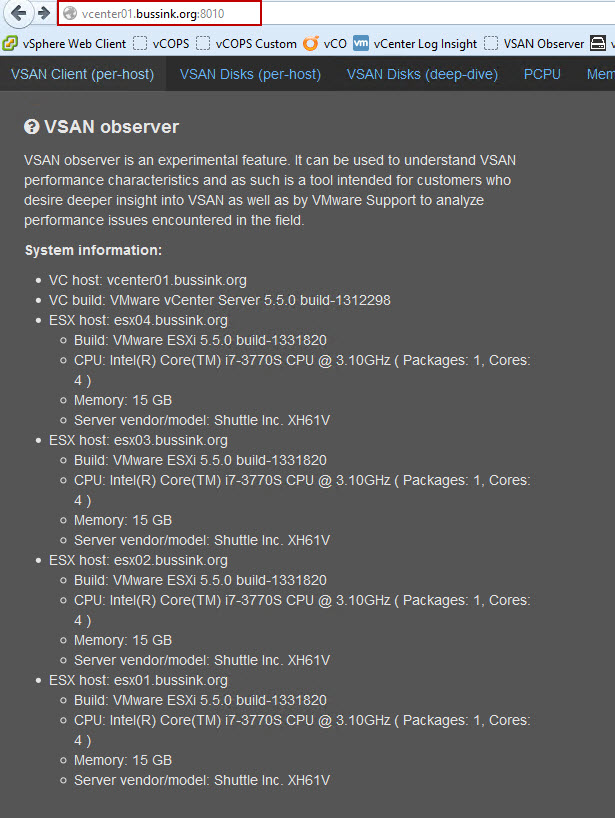
“VSAN observer is an experimental feature. It can be used to understand VSAN performance characteristics and as such is a tool intended for customers who desire deeper insight into VSAN as well as by VMware Support to analyze performance issues encountered in the field.” This is the tool any tester of VSAN can use to monitor his hosts, disks, VMs and see the distribution across hosts.
Rawlinson (@PunchingClouds) has created two very interesting articles on the VSAN Observer, which I’ve been hearing about for a few weeks. In his posts, Rawlinson shows how to use the VSAN observer that comes with the vCenter Appliance Using RVC VSAN Observer Pt1 and Using RVC VSAN Observer Pt2. I will show you here how to use the one that comes with the Windows implementation of vCenter 5.5
The VSAN Observer runs on the Ruby vSphere Console (RVC). Ruby vSphere Console (RVC) is a Linux console UI for vSphere, built on the RbVmomi bindings to the vSphere API. The vSphere object graph is presented as a virtual filesystem, allowing you to navigate and run commands against managed entities using familiar shell syntax.Your vCenter 5.5 ships with RVC installed.
Starting your own VSAN Observer
In the vCenter 5.5 server under the path C:\Program Files\VMware\Infrastructure\VirtualCenter Server\support\rvc you will find the rvc.bat file. Edit the rvc.bat file with notepad or notepad++ and jump at the end of the line to change the name of the user that will connect to the vCenter and the name of the vCenter. That can be seen from the output below in the first orange box.
- Remember that the Ruby vSphere Console and the VSAN Observer tool are an experimental feature. There is no user authentication to the VSAN Observer website, and I’ve found out that the VSAN Observer process dies after a few hours.
Once you launch the RVC tool and enter the password for your vCenter account, you can use RVC commands. You can use ls to list objects, or cd <number> to drill down in an object. William Lam (@lamw) has some interesting articles about RVC (RVC 1.6 released)
But the command you want is to launch the vsan.observer program that will launch a webserver to which you can connect on port 8010 (Second orange box).
vsan.observer <vcenter-hostname>/<Datacenter-name>/computers/<Cluster-Name>/ –run-webserver –force
or for me
vsan.observer vcenter01.bussink.org/Home/computers/Management\ Cluster/ –run-webserver –force

To stop the vsan.observer process you can stop it with a double Ctrl+C.
VSAN Observer Web interface
So now that you have your vsan.observer running, let’s connect to it with a browser on port 8010. This is the About section that will list your VSAN hosts.
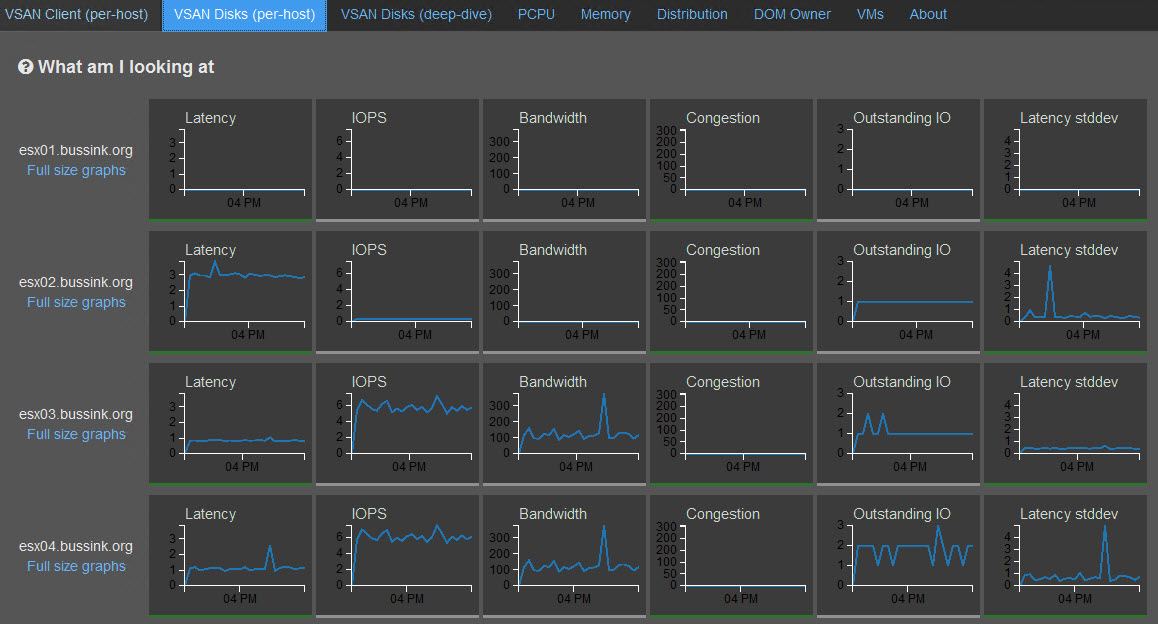
But you can get some very interesting information about your Hosts such as VSAN Disks (per-host).
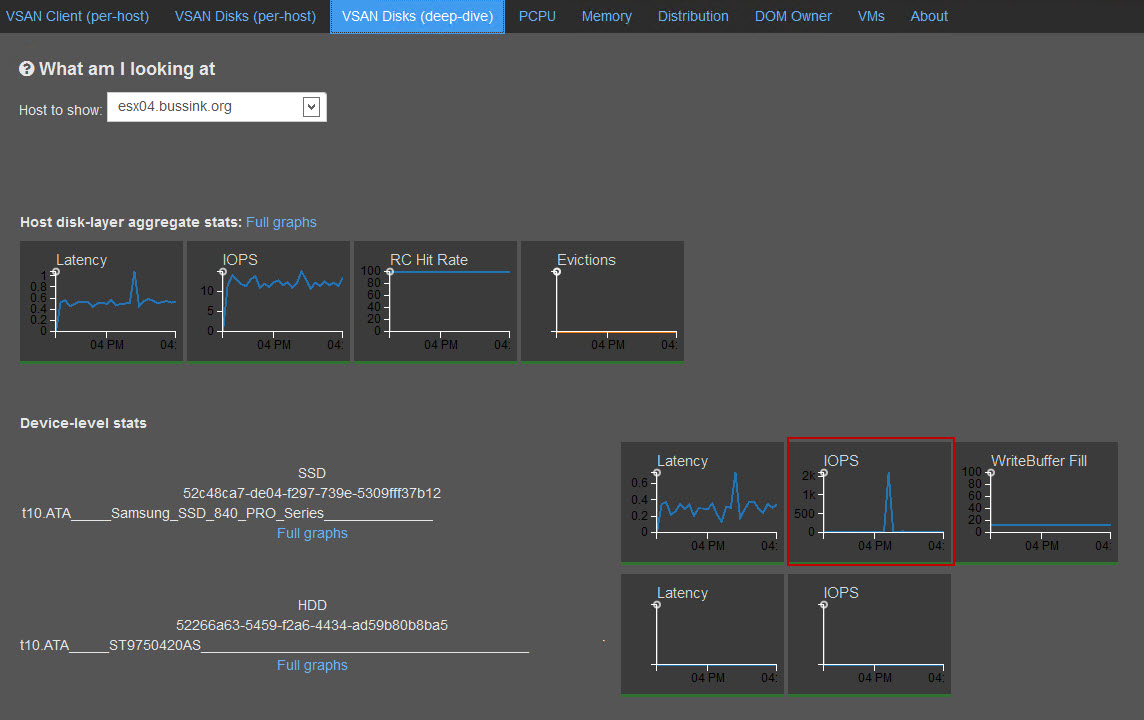
Here is the VSAN Disk (deep-dive) to see the performance of the SSD caching in front of the magnetic disk. Here the vCenter Log Insight appliance kept on the VSAN, had a peak during a reboot.
You can also drill deep with the Full graphs to get more details of the write operations on the SSD.
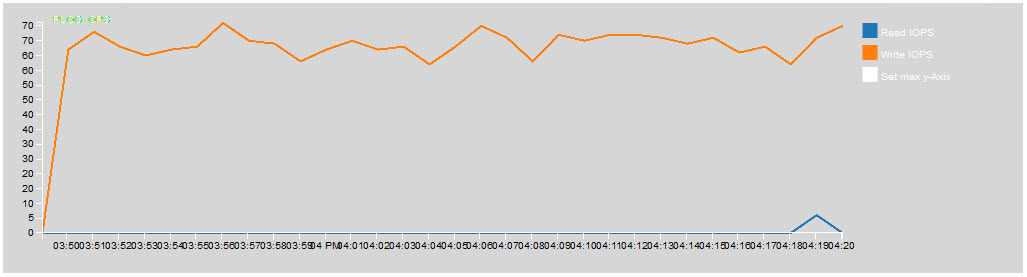
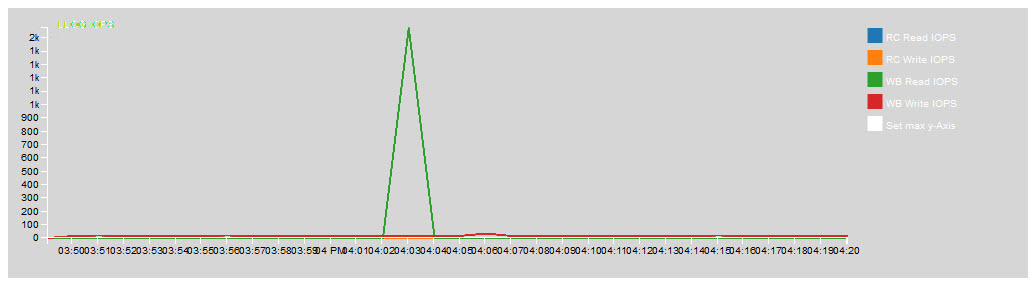
These charts are not always the easiest to read. But you will find great stuff here.
VM VSAN Stats with Backing Storage.
The is the most interesting charts I’ve found. This is where you can see the different component of the storage backing your VM. My Storage Policu for the vCenter Log Insight is placed in the vCenter with a VSAN Redundancy policy (Number of failures to tolerate = 1).
I recommend you see this picture in full size, to better see the various details.

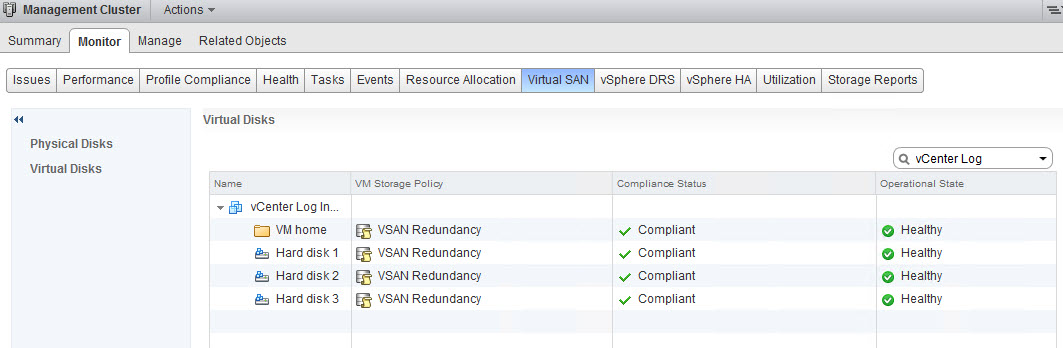
This below is the original view you get with the vSphere Web Client view from the Monitor, Virtual SAN and on the VM.
After having played a bit with the RVC VSAN Observer in the last 24 hours. I think this will be an interesting tool for Storage IO analysis. I really hope this makes it into a Fling or a full plugin for the vCenter server.
VSAN Observer Firewall rule
If your vCenter Server 5.5 is running on a Windows hosts with the integrated firewall activated. Here is the rule to open the port on your system to check the VSAN Observer, from another machine.
netsh advfirewall firewall add rule name = “VMware RVC VSAN Observer” dir = in protocol = tcp action = allow localport = 8010 remoteip = localsubnet profile = DOMAIN