In this post, I will describe the storage design I use for my virtual infrastructure lab. I have been using the Community Edition of NexentaStor for the past two and a half year already. And I can tell already in the first paragraph of this post, that it’s a very impressive storage solution, which can scale to your needs and based on the budget you are ready to allocate to it.
I have played with various virtual storage appliances (VSA) from NetApp and EMC, and I used Openfiler 2.3 (x86-64) prior to moving to NexentaStor in my lab over 2.5 years ago. I was not getting the storage performance from the VSA, and it was difficult to add disks and storage to these VSA. The Community Edition of NexentaStor supports 18 TB of usable storage without requiring a paying license (you do need to register your Community Edition with Nexenta to get a license). I don’t believe a lot of people are hitting this limit in their labs. In addition, since NexentaStor 3.1, the VAAI primitives are supported with iSCSI traffic. There simply is no other way to test VAAI in a virtualization lab without spending some serious money.
Here are the current release notes for NexentaStor 3.1.2 and you can download the NexentaStor Community Edition 3.1.2 to give it a go. Version 4 of NexentaStor is planned for the summer of 2012. It will use the Illumos. I’m looking forward to the next release of NexentaStor.
Hardware.
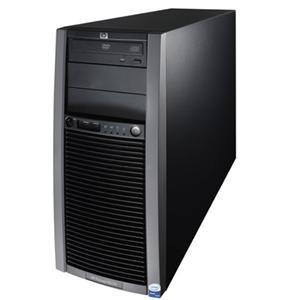
- My current implementation of NexentaStor is currently using an HP ProLiant ML150 G5 with a single quad-core Xeon 5410 (@2.33 GHz and 12MB of L2 Cache) and 16GB of ECC Memory.
- My current hard disks are three year old 1TB SATA disks. They are definitely the weak point of my infrastructure at the present time, and I should really replace these aging disks by bigger and faster disks.
- I recently added three performant Intel 520 Series SSD. I took three 60GB disks. I’ve got Intel SSD in the past, and they are still very reliable, so the choice was not difficult. The 60GB versions of these disks are speced at 6700 IOPS RandomWrite, and 12000 IOPS RandomRead (I took the lowest numbers from the various Intel documentation). Getting larger disks would result in better IOPS performances and the drive would have more lifetime writes, but that would increase the cost of my storage.
- On the Network side, I have added an Intel based Dual gigabit server network card. My management traffic and NFS traffic arrive on the mainboard network card, and my iSCSI stack is presented using two IP addresses on the very good Supermicro AOC-SG-i2 network card. The Supermicro AOC-SG-i2 has dual Intel 82575EB chips. The iSCSI traffic is set to use a 9000 MTU, and I have an EtherChannel trunk (2x1Gbps) across the network switches (two Cisco SG300-28) from the HP ProLiant ML150 G5 to the ESXi servers in a second room.
Storage Layout.
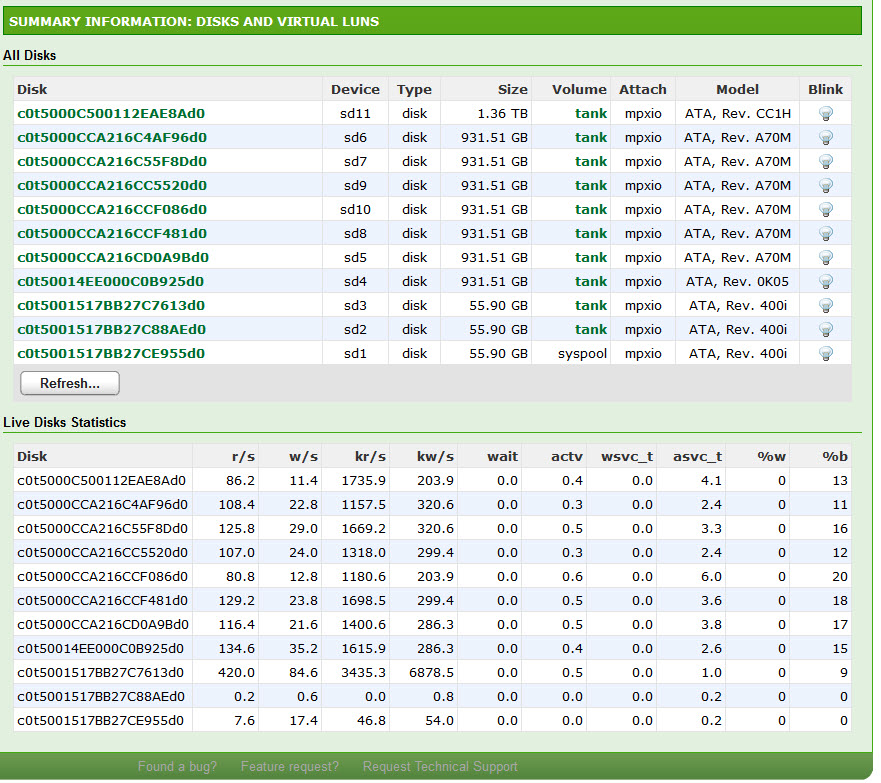
Here is a screenshot of my storage layout I’m now using. I used to have a single large RAIDZ2 configuration last year, which was giving me a lot of space, but I found the system lacking on the write side, so I exported all my virtual machines from the NexentaStor server, and reformatted the storage using mirror of disks to improve the write speed.
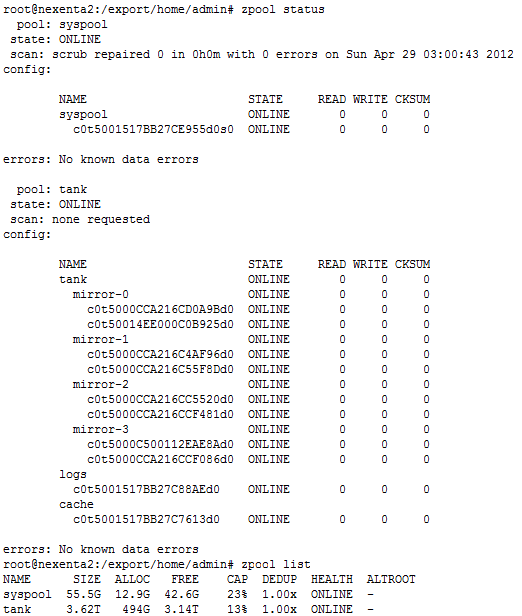
zpool status & zpool list
As you can see in the previous screenshot, my tank zvol is composed of four set of mirrored disks, and I’m using two Intel SSD 520 60GB. One as the L2ARC cache, and one as the ZLOG cache disk.
Because I don’t have more than 16GB of RAM in the HP ProLiant ML150 G5, I decided not to use the De-dupe functionality of the NexentaStor. From Constantin’s blog, it seems like a good rule of thumb is 5GB of dedupe in ARC/L2ARC per TB of deduped pool space. I have about 3.6TB of disk, so that’s would require about 18GB (if I want to keep the De-dupe tables in RAM instead of the L2ARC).
I have enough CPU resources with the Quad-Core Xeon 5410 (@ 2.33GHz) to run the compression on the storage.
NexentaStor and VMware’s vStorage API for Array Integration (VAAI)
Nexenta introduced support for VMware’s vStorage API for Array Integration (VAAI). Specifically four SCSI commands have been added to improve the performance of several VMware operations when using iSCSI or FC connections. Following is a brief summary of the four functions, as described in the NexentaStor 3.1 release notes.
- SCSI Write Same: When creating a new virtual disk VMware must write’s zeros to every block location on the disk. This is done to ensure no residual data exists on the disk which could be read by the new VM. Without Write Same support the server’s CPU must write each individual block which consumes a lot of CPU cycles. With the Write Same command VMware can direct the storage array to perform this function, offloading it from the CPU and thereby saving CPU cycles for other operations. This is supported in ESX/ESXi 4.1 and later.
- SCSI ATS: Without ATS support, when VMware clones a VM it must lock the entire LUN to prevent changes to the VM while it is being cloned. Howerver, locking the entire LUN affects all other VM’s that are using the same LUN. With ATS support VMware is able to instruct the array to lock only the specific region on the LUN being cloned. This allows other operations affecting other parts of the LUN to continue unaffected. This is supported in ESX/ESXi 4.1 and later.
- SCSI Block Copy: Without Block Copy support, cloning a VM requires the server CPU to read and write each block of the VM consuming a lot of server CPU cycles. With Block Copy support VMware is able to instruct the array to perform a block copy of a region on the LUN corresponding to a VM. This offloads the task from the server’s CPU thereby saving CPU cycles for other operations. This is supported in ESX/ESXI 4.1 and later.
- SCSI Unmap: Provides the ability to return freed blocks in a zvol back to a pool. Previously the pool would only grow. This enables ESXi to destroy a VM and return the freed storage back to the zvol. ESXi 5.0 and later support this functionality.
I’m covering the setting up of the iSCSI on the NexentaStor for vSphere in a separate post: Configuring iSCSI on Nexenta for vSphere 5.
vSphere 5 iSCSI Configuration
Here are some screenshots of how I setup the iSCSI configuration on my vSphere 5 cluster. The first one is the iSCSI Initiator with two iSCSI network cards.
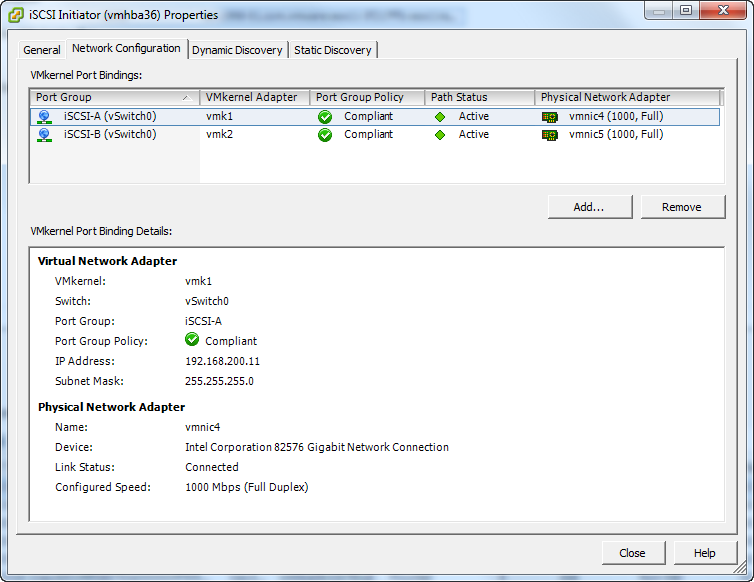
vSphere 5 iSCSI Initiator VMkernel Port Bindings
Then I presented four 601GB LUNs to my vSphere 5 Cluster. You can see in the following screenshot those four LUNs with LUN ID 1,2,3,4, while the small 4GB LUNs with ID 7,8,9 are the RDM LUNs I’m presenting for the I/O Analyzer tests. We see that the Hardware Acceleration is Supported.
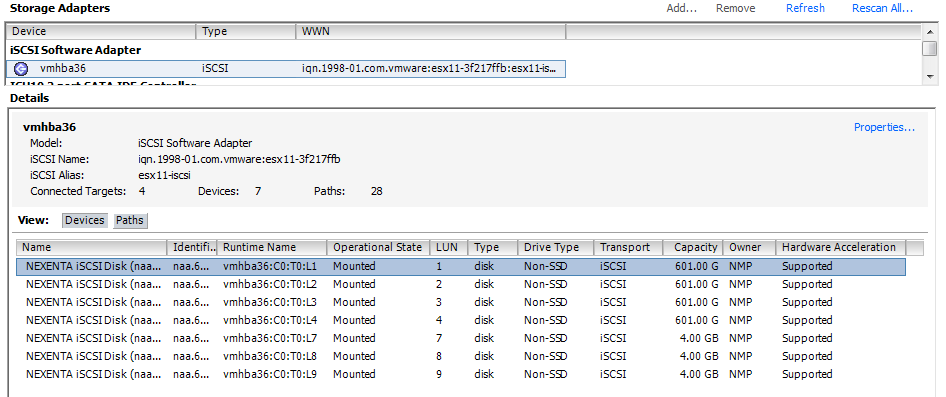
- NexentaStor iSCSI LUNs presented to vSphere
For each of these 601GB presented LUN, I modified the Path Selection from Most Recently Used (VMware) to Round Robin (VMware) and we see that all four paths are now Active (I/O) paths. iSCSI traffic is load balanced on both iSCSI network interfaces.
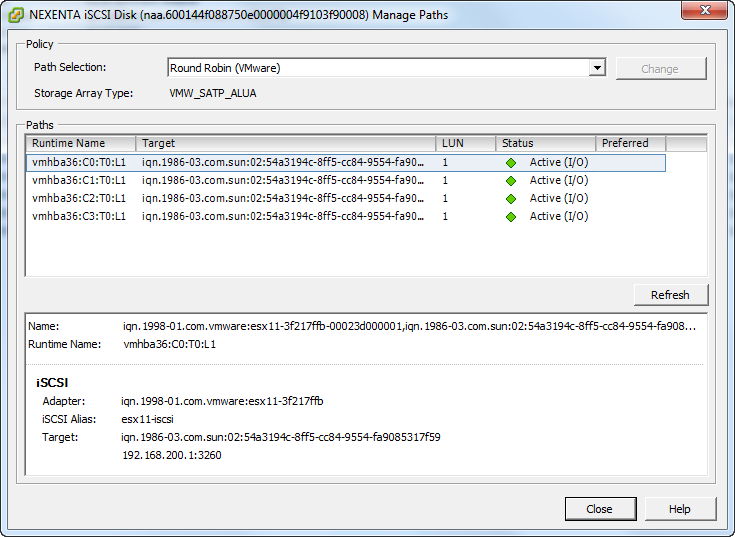
vSphere 5 iSCSI LUNs Path Selection set to Round Robin (VMware)
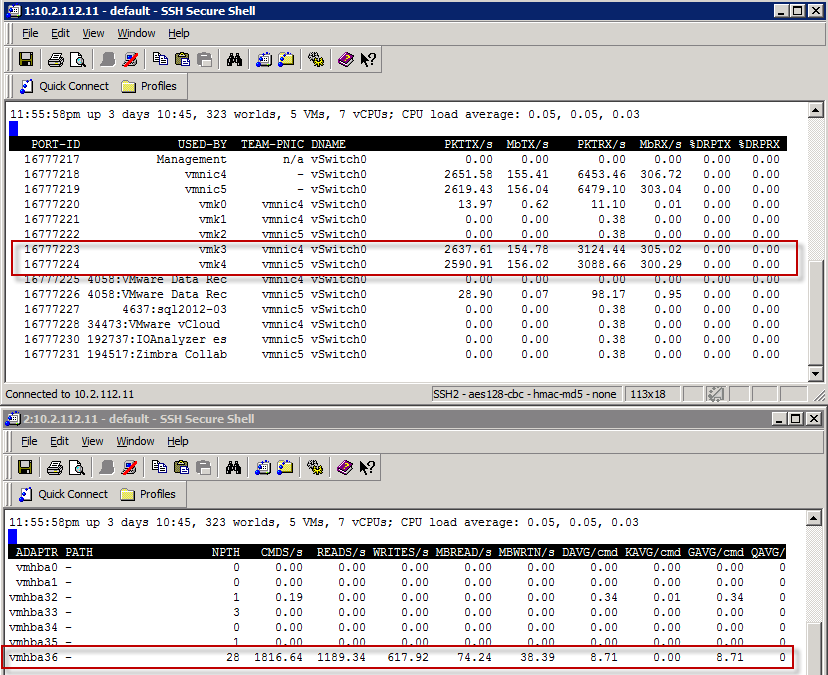
To see the load balancing across both iSCSI Network cards, I can quickly demo it with the IO Analyzer 1.1 doing a Max Throughput test (Max_Throughput.icf). I will show the results later in the post, but let’s first have a peak at the ESXTOP running from a vMA against my ESXi host. On this host, the two iSCSI vmkernel nics are vmk3 and vmk4.
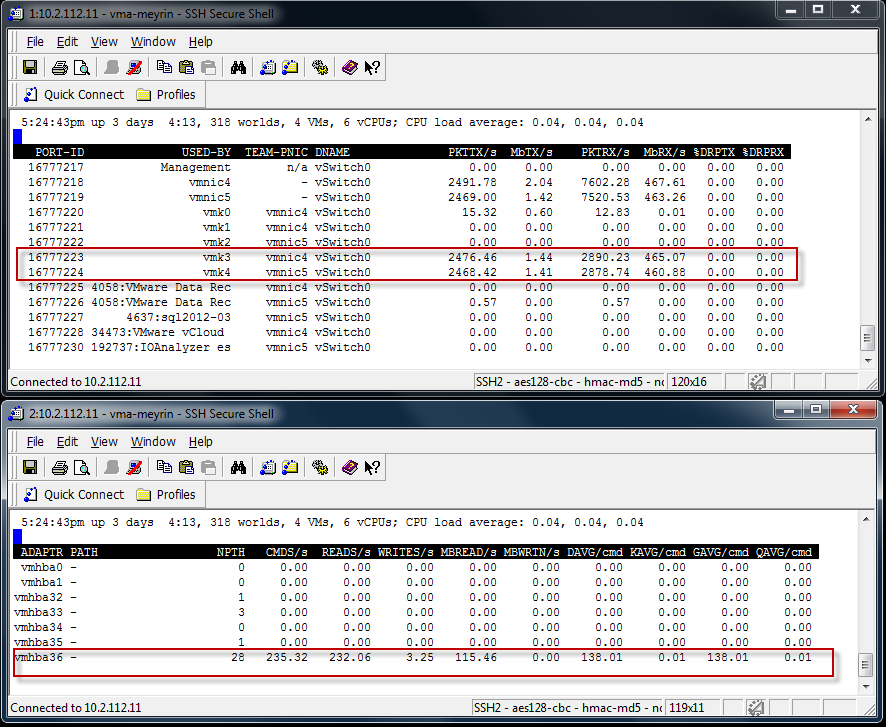
IO Analyzer doing Max Throughput test. Load balanced iSCSI Traffic with Nexenta CLI
and with the vSphere 5 Client, we can see that the traffic is using both the physical vmnic4 and vmnic5.
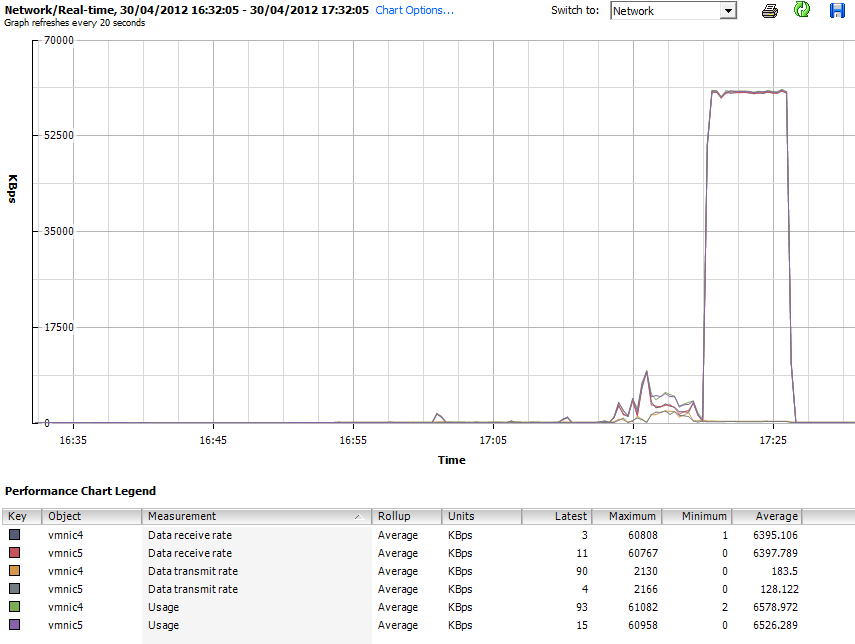
- IO Analyzer doing Max Throughput test. Load balanced iSCSI Traffic with Nexenta
VMware’s Fling I/O Analyzer 1.1 benchmarking
These are the test I ran on my infrastructure with VMware’s Fling I/O Analyzer 1.1. The Fling I/O Analyzer deploys a virtual appliance running Linux, with a WINE implementation of the iometer on it. I highly recommend that you watch the following I/O Analyzer vBrownBag by Gabriel Chapman (@bacon_is_king) from March 2012 to understand how you can test your infrastructure.
Maximum IOPS
Here are the three screenshots of the IO Analyzer running MAX_IOPS.icf (512b block 0% Random – 100% Read) against my NexentaStor. While it gives nice stats, and I’m the proud owner of a 55015 IOPS storage array, it’s not representative of day to day workload that the NexentaStor gives me.
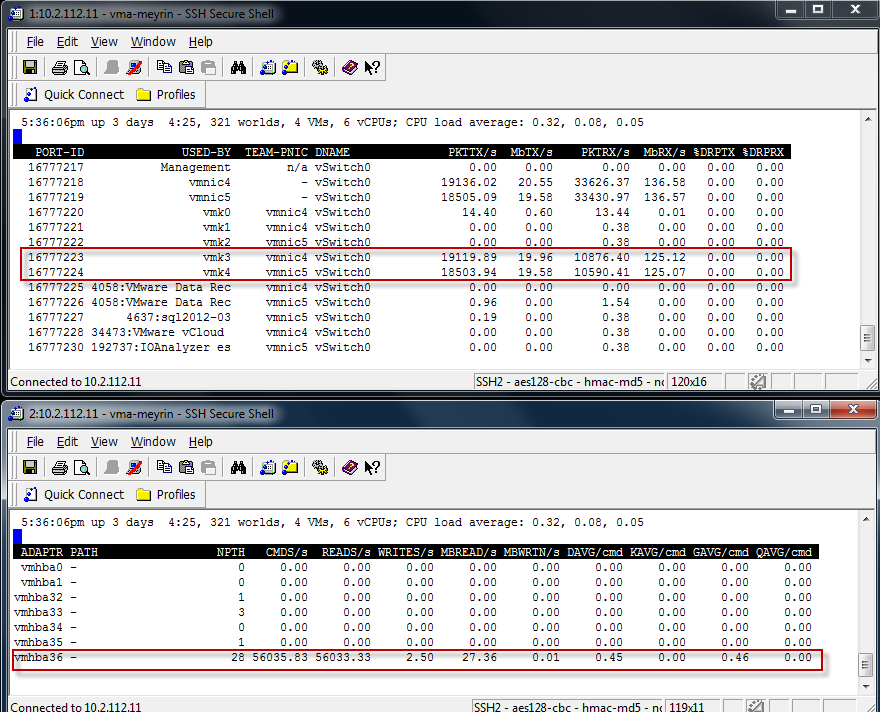
- IO Analyzer Max_IOPS Test from the vMA
In the next graphic, the 2nd set of tests to the right is the Max IOPS Test. There is a spike. But we clearly see that when pushing the system with 512 Byte Sequential Read, the Throughput is down from the Max Throughput test I used earlier.
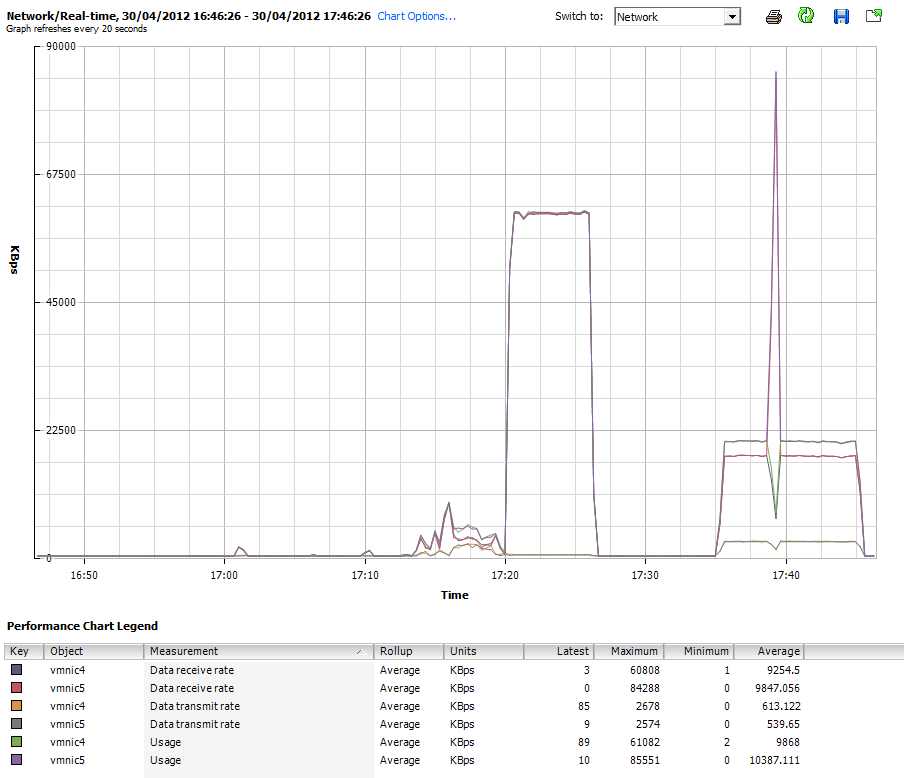
IO Analyzer Max_IOPS Test from the vSphere 5 Client
And now lets the results in the IO Analyzer for the Max_IOPS.icf test. Result is 55015 Read IOPS.

IO Analyzer results for Max_IOPS.icf
Maximum Write Throughput
This test will measure the maximum Write Throughput to the NexentaStor server Using the Max Write Throughput test (512K, 100% Sequential, 100% Write)
This is the screenshot from the vMA showing the load balancing Write traffic.
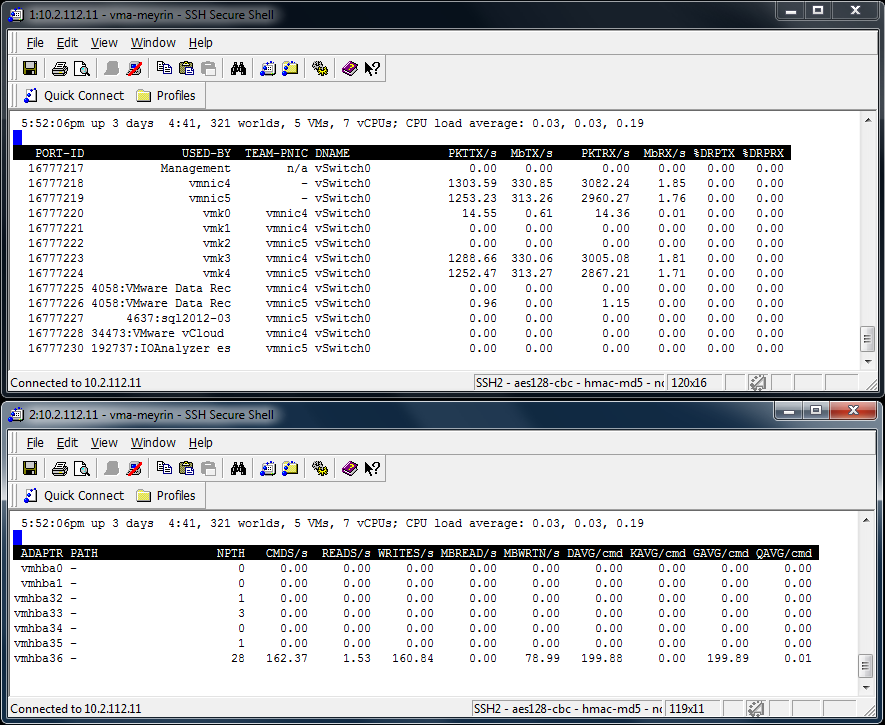
IO Analyzer running MaxWriteThroughPut from the vMA
vSphere 5 Client Performance chart of the iSCSI Load Balancing (Network Chart)
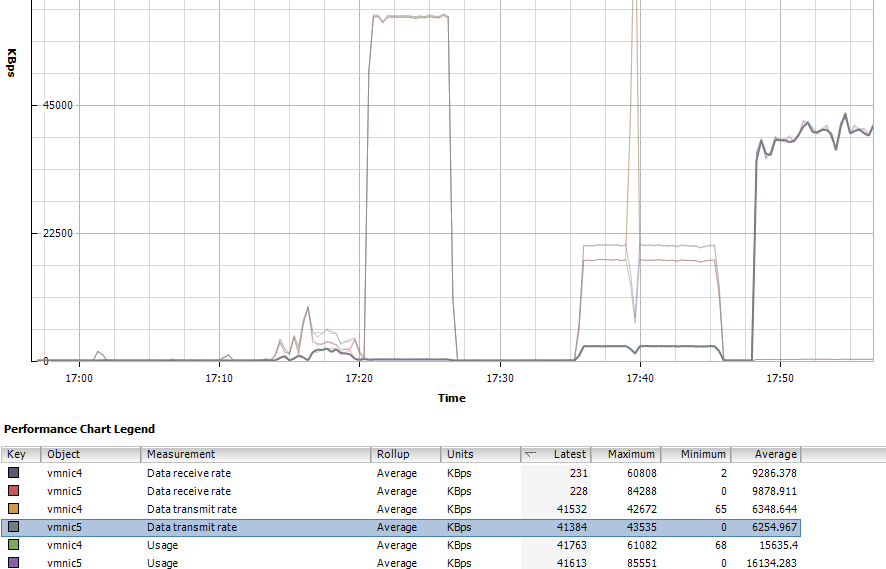
IO Analyzer running MaxWriteThroughPut (Network) from the vSphere 5 Client
vSphere 5 Client Performance chart of the ESXi Write Rate (Disk Chart)
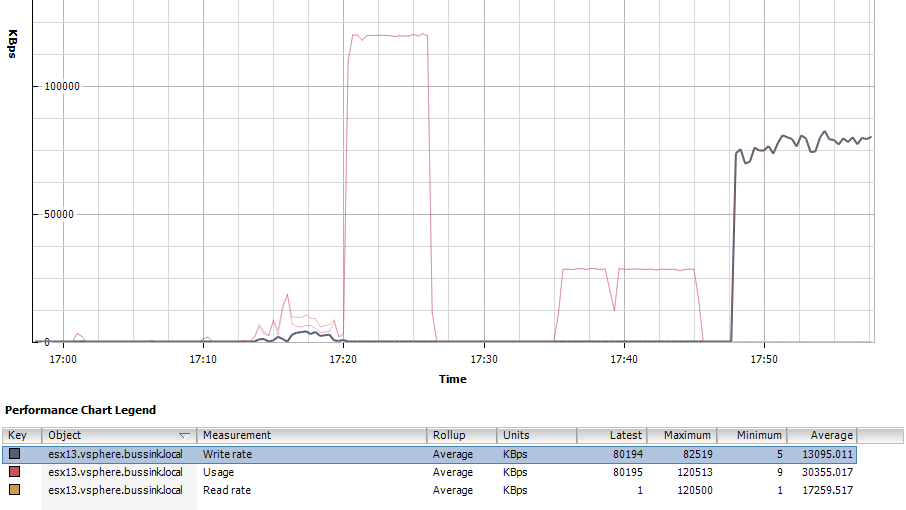
IO Analyzer running MaxWriteThroughPut (Disk from the vSphere 5 Client
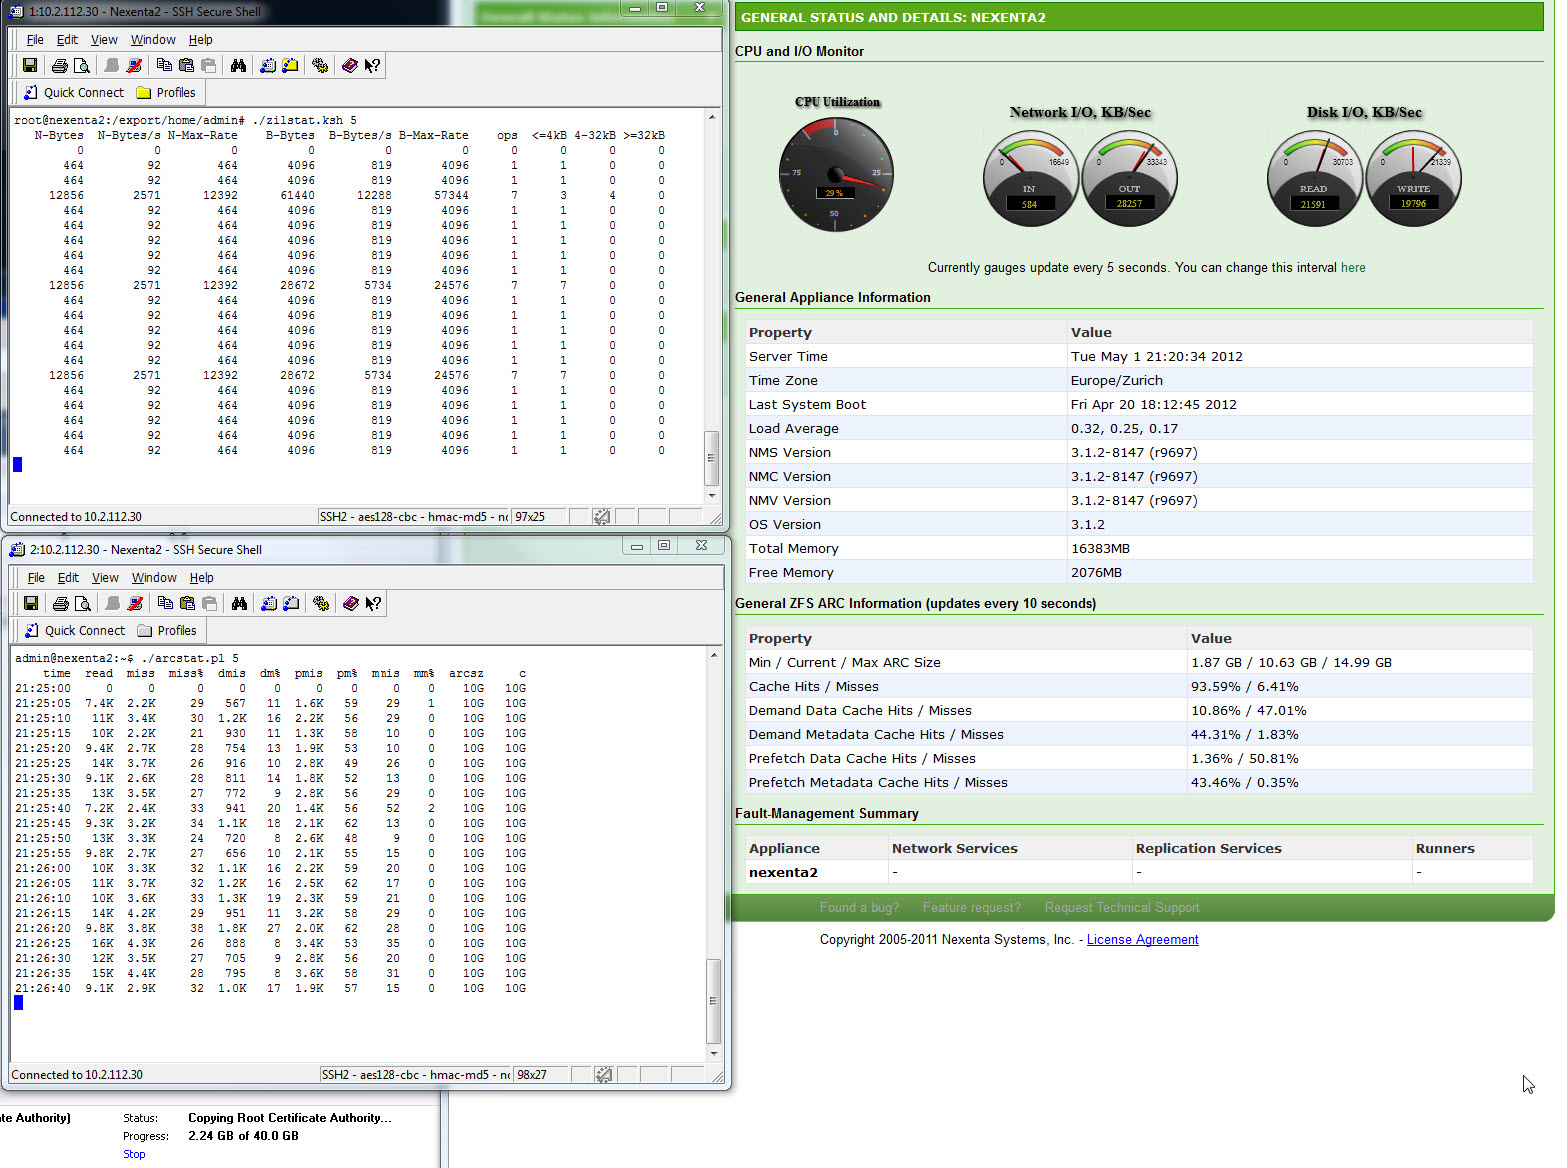
Here is the view from the Nexenta General Status, where you have two speedometers. Notice that the CPU is running at 42% due to Compression being enabled on my ZVOL.

Nexenta GUI Status when running the Max Write Throughput test
And the result from the IO Accelerator for the Max Write Throughput Test. 75 MB/s or 151 WriteIOPS.

IO Analyzer Results for Max Write Throughput with the Nexenta
SQL Server Load
Now le’ts look at the SQL Server 64K test run on the I/O Analyzer. The test uses 64K blocks
IO Analyzer running SQL Server 64K test on Nexenta
Here is the vSphere 5 Client performance chart for the Disk. We see a nice 66% througput on Read and 33% on Write.
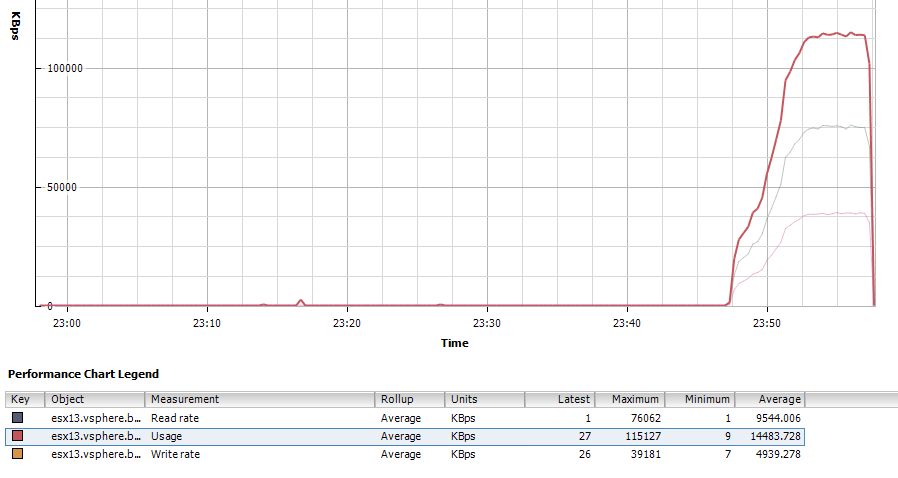
IO Analyzer running SQL Server 64K test on Nexenta (Disk Chart)
and the results giving us a nice 1354 total IOPS (893 ReadIOPS and 461 WriteIOPS).

IO Analyzer SQL Server 64K Results
Max IOPS from Three ESXi Hosts
One final test with IO Analyzer is to run three concurrent tests across three ESXi host on the same NexentaStor server. I’m using the Max_IOPS test (512b block 0% Random – 100% Read). We will notice that running the same test from Three sources instead of a single ESXi host, will result in a lower total IOPS result. So instead of a 55015 IOPS, we are getting and average of 12800 IOPS per host or a total of 38400 IOPS. Not bad at all for a lab storage server.
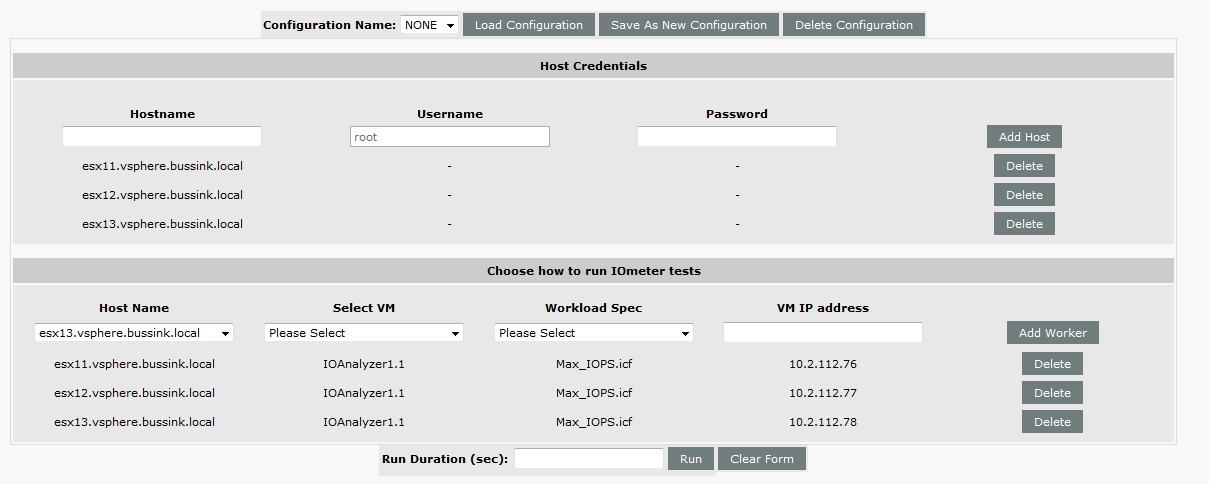
3x IO Analyzer running on dedicated Host in parallel
and the results are

3x IO Analyzer running on dedicated Host in parallel Results
Bonnie++ Benchmarking
I installed the Bonnie++ benchmark took directly on the Nexenta server, and I ran it multiple times, with a 48GB data file (so it’s three times larger than the RAM of my server).
Here are my results, and I apologize already for the very wide formatting this next HTML table will do to this post.
| Version 1.96 |
Sequential Output |
Sequential Input |
Random
Seeks |
|
Sequential Create |
Random Create |
|
Size |
Per Char |
Block |
Rewrite |
Per Char |
Block |
Num Files |
Create |
Read |
Delete |
Create |
Read |
Delete |
|
K/sec |
% CPU |
K/sec |
% CPU |
K/sec |
% CPU |
K/sec |
% CPU |
K/sec |
% CPU |
/sec |
% CPU |
|
/sec |
% CPU |
/sec |
% CPU |
/sec |
% CPU |
/sec |
% CPU |
/sec |
% CPU |
/sec |
% CPU |
| Nexenta2 HP ML150 G5 Tank&Compression&Cache&Log |
48G |
98 |
99 |
381672 |
85 |
262061 |
82 |
254 |
99 |
597024 |
69 |
6300 |
125 |
16 |
7013 |
42 |
+++++ |
+++ |
12665 |
60 |
12612 |
62 |
+++++ |
+++ |
14078 |
56 |
| Latency |
85847us |
298ms |
400ms |
39001us |
121ms |
114ms |
Latency |
25709us |
795us |
250us |
16031us |
30us |
323us |
| Nexenta2 HP ML150 G5 Tank&Compression&Cache&Log |
48G |
101 |
99 |
383428 |
86 |
265270 |
83 |
250 |
97 |
595142 |
69 |
7034 |
142 |
16 |
7742 |
46 |
+++++ |
+++ |
12861 |
60 |
13023 |
65 |
+++++ |
+++ |
13884 |
56 |
| Latency |
90145us |
270ms |
401ms |
170ms |
145ms |
53417us |
Latency |
25757us |
118us |
330us |
16036us |
32us |
365us |
| Nexenta2 HP ML150 G5 Tank&Compression&Cache&Log |
48G |
101 |
99 |
380309 |
85 |
256859 |
80 |
250 |
98 |
593337 |
69 |
10018 |
154 |
16 |
7290 |
44 |
+++++ |
+++ |
12650 |
61 |
12324 |
62 |
+++++ |
+++ |
14074 |
57 |
| Latency |
92352us |
245ms |
394ms |
173ms |
85135us |
62798us |
Latency |
26885us |
118us |
1564us |
16120us |
63us |
279us |
| Nexenta2 HP ML150 G5 Tank&Compression&Cache&Log |
48G |
102 |
99 |
379416 |
85 |
255191 |
79 |
248 |
97 |
579578 |
68 |
5067 |
106 |
16 |
7103 |
43 |
+++++ |
+++ |
12781 |
61 |
13253 |
66 |
+++++ |
+++ |
14503 |
59 |
| Latency |
91351us |
225ms |
1413ms |
270ms |
98217us |
41929us |
Latency |
25746us |
120us |
233us |
15943us |
124us |
227us |
| Nexenta2 HP ML150 G5 Tank&Compression&Cache&Log |
48G |
101 |
99 |
387046 |
86 |
257276 |
80 |
255 |
99 |
557928 |
65 |
11517 |
187 |
16 |
7070 |
42 |
+++++ |
+++ |
12651 |
61 |
13029 |
64 |
+++++ |
+++ |
13838 |
56 |
| Latency |
94237us |
370ms |
332ms |
38815us |
90411us |
46669us |
Latency |
25788us |
110us |
234us |
15918us |
21us |
252us |
| Nexenta2 HP ML150 G5 Tank&Compression&Cache&Log |
48G |
101 |
99 |
381530 |
85 |
258287 |
80 |
255 |
99 |
550162 |
64 |
10903 |
179 |
16 |
7314 |
45 |
+++++ |
+++ |
12640 |
60 |
11857 |
59 |
+++++ |
+++ |
13789 |
57 |
| Latency |
99227us |
243ms |
398ms |
51192us |
73688us |
45083us |
Latency |
26538us |
140us |
234us |
15924us |
43us |
301us |
| Nexenta2 HP ML150 G5 Tank&Compression&Cache&Log |
48G |
101 |
99 |
381556 |
86 |
258073 |
80 |
253 |
99 |
561755 |
65 |
5144 |
108 |
16 |
6805 |
41 |
+++++ |
+++ |
12625 |
60 |
12844 |
63 |
+++++ |
+++ |
14847 |
59 |
| Latency |
91342us |
291ms |
418ms |
82618us |
112ms |
54898us |
Latency |
25738us |
113us |
375us |
15928us |
27us |
205us |
| Nexenta2 HP ML150 G5 Tank&Compression&Cache&Log |
48G |
101 |
99 |
383434 |
85 |
259550 |
80 |
253 |
99 |
553803 |
65 |
5869 |
126 |
16 |
6724 |
40 |
+++++ |
+++ |
12236 |
59 |
11574 |
57 |
+++++ |
+++ |
13511 |
54 |
| Latency |
91320us |
347ms |
383ms |
87805us |
108ms |
117ms |
Latency |
25753us |
113us |
232us |
15908us |
55us |
181us |
The test was run on a ZVOL that had the Compression enabled, It was backed with a Intel SSD 520 60GB disk for the L2ARC Cache and a Intel SSD 520 60GB disk for the zlog.
There are some spikes here and there. but in average, the Bonnie++ is telling me that local storage access is capable of
- Sequential Block Reads: 381530K/sec (381MB/sec)
- Sequential Block Writes: 550162K/sec (550MB/sec)
- Rewrite: 255191K/sec (255MB/sec)
- Random Seeks: 5067/sec
Additional Resources:
In the past week, Chris Wahl over at http://wahlnetwork.com/ has writen four excellent articles about using NFS, Load Balancing and the Nexenta Community Edition server. I highly recommend you look up these articles to see how you can improve your Nexenta experience
- Misconceptions on how NFS behaves on vSphere by Chris Wahl
- Load balancing NFS deep dive in both a single subnet by Chris Wahl
- Load balancing NFS deep dive with multiple subnet by Chris Wahl
- and NFS on vSphere – Technical Deep Dive on Load Based Teaming by Chris Wahl
